
Why Are California Drivers So Bad?
If you’ve ever driven in the Golden State, you might wonder why California drivers are so bad. Here’s a closer look at the reasons behind what you might see on the roads.
Best Online Traffic School Blog
This section is the data behind the driving advice. Best Online Traffic School compiles California and national statistics on crashes, tickets, distracted driving, impaired driving, and driver behavior from primary sources such as the California Highway Patrol’s SWITRS database, the DMV, the NHTSA, and the Insurance Institute for Highway Safety, and publishes them in plain language with the source cited for every figure.
You will find the annual California car crash statistics, texting and driving statistics, drunk driving statistics, bicycle accident statistics, the numbers on backover accidents and road rage, and the research on why drowsy driving carries risks similar to driving under the influence. There are also studies of driver behavior, including our own survey work on how Californians feel about driving and why they are driving less.
The figures are updated as new data is released, each article notes the year of the data it uses, and older figures are kept for comparison rather than deleted. Where two sources disagree, the article says so rather than picking the more dramatic number.
Journalists, teachers, and researchers are welcome to cite these pages with a link back. If you are here because of a ticket rather than a research project, the course itself is DMV-licensed and accepted by every California court, and finishing it keeps an eligible one-point violation off your insurance record.
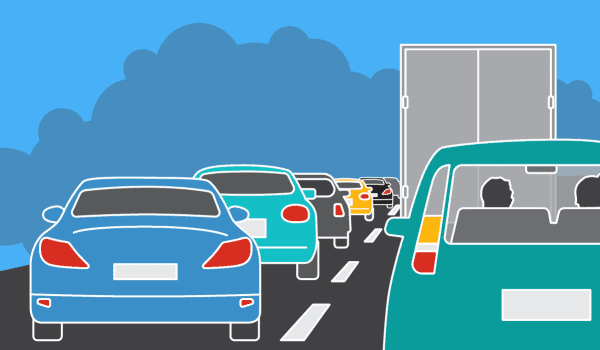
If you’ve ever driven in the Golden State, you might wonder why California drivers are so bad. Here’s a closer look at the reasons behind what you might see on the roads.
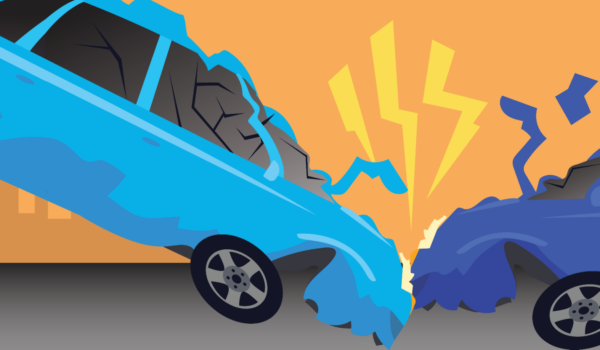
California car crash statistics raise concerns about road safety and driving behavior. Here’s what the numbers say and why you should care.
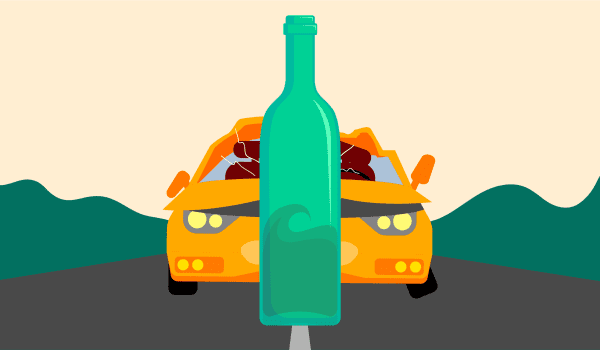
The latest drunk driving statistics reveal a growing number of alcohol-related traffic fatalities. Here’s what the numbers say, and why you should care.

California texting and driving statistics reveal a growing number of fatal crashes related to cell phone use. Let’s see what the numbers say and why it matters.
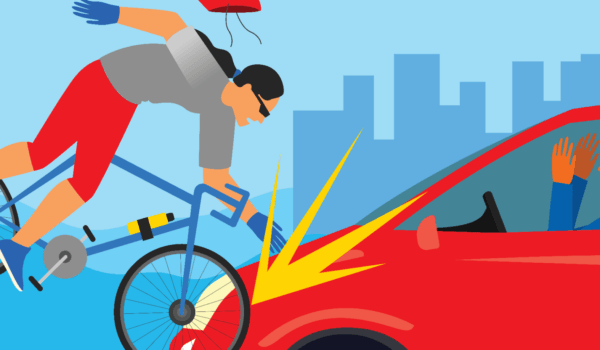
The latest bike accident statistics confirm that cyclists are among the most vulnerable road users. Let’s go over these figures and why they matter.