Traffic fatalities decreased from 3,970 in December 2022 to 3,740 in the same month of 2023, according to a National Safety Council (NSC) report. However, motor vehicle crashes remain a leading cause of death in the U.S.
Although many of us get into cars every day without considering the risk, they can be a dangerous mode of transportation. In the wrong hands, a car can become a lethal weapon. But even if you’re a good driver, it takes just one moment of inattention to cause a tragedy on the road.
That said, let’s go over the latest car crash statistics in California and nationwide.
California Car Crash Statistics
In the first half of 2023, more than 2,000 people lost their lives on California roads, according to the National Highway Traffic Safety Administration (NHTSA). This number was 12% lower compared to 2022, but that doesn’t change things for the victims and their loved ones.
Sadly, car crashes are common and often deadly in the Golden State. Here are some of the most shocking statistics released since 2020 and beyond.
- 2,061 people died in motor vehicle crashes in the first six months of 2023. Another 2,341 people lost their lives in car accidents during the same period of the previous year, per the NHTSA.
- The number of traffic fatalities in California reached 4,285 in 2021. A staggering 35% were due to speeding. That’s significantly higher compared to the percentage of speeding-related fatalities nationwide (29%).
- Between 2020 and 2021, speeding-related deaths in California rose 16.5%.
- 336 people, including 179 pedestrians, lost their lives on L.A.’s streets in 2023. This was the highest number of traffic fatalities recorded in the city over the past 20 years, per the Los Angeles Times.
- The city also witnessed an 8% increase in fatal crashes and a 23% increase in fatal hit-and-runs in 2023, resulting in 106 deaths.
- In 2020, nearly 4,000 people were killed and another 203,888 were injured in car crashes, according to the California Highway Patrol (CHP).
- The same year, a fatal or injury-causing crash took place every four minutes. As a result, one person died every two hours and 11 minutes, and one person sustained traffic-related injuries every two hours and a half, per the CHP.
| California Highway Patrol Statewide Integrated Traffic Records System (SWITRS), 2020 | |
| 3,672 | Fatal crashes |
| 3,982 | People killed in crashes |
| 143,476 | Injury crashes |
| 203,888 | Road participants injured in crashes |
| 1.42 people were injured in each injury-causing crash | |
According to the California Office of Traffic Safety (OTS), in 2021 (the most recent year for which data is available):
- Traffic-related deaths increased by 7.6% between 2020 and 2021, from 3,980 to 4,285.
- 1.38 people were killed for every 100 million miles traveled by Californians in 2021.
- Deaths of passengers who were not wearing their seatbelts increased 12.4% between 2020 and 2021, from 782 to 878.
| CALIFORNIA CAR CRASH STATISTICS | ||
| 2020 | 2021 | |
| Traffic fatalities | 3,980 | 4,285 |
| Deaths of passengers who were not wearing seatbelts | 782 | 878 |
According to the NHTSA, 22,459 people died and 57,281 were involved in fatal crashes in California between 2017 and 2022.
But that’s not all.
Based on 2023 data, the Golden State is home to seven of the cities with the worst drivers in America, including:
- Riverside
- Fresno
- Sacramento
- Bakersfield
- Los Angeles
- San Francisco
- San Diego
It’s also the second worst state for drivers in the nation, and four of its cities have the highest crash rates in the U.S. These include:
- San Diego
- Los Angeles
- Sacramento
- Riverside
In 2021, the Insurance Institute for Highway Safety (IIHS) reported that California had the highest number of fatal motor vehicle crashes in the country.
However, that’s only because it’s one of the most populous states. When fatalities are adjusted by population, South Carolina has the most deaths per 100 million miles traveled (2.08), and Mississippi has the most deaths per 100,000 people (26.2).
It’s also worth mentioning that 70% of all traffic fatalities in California take place in urban areas. In most other states, the majority of fatal car crashes occur in rural areas.
Traffic school can help you keep a clean driving record, prevent insurance increases, and more!
Most Common Causes of Car Crashes in California
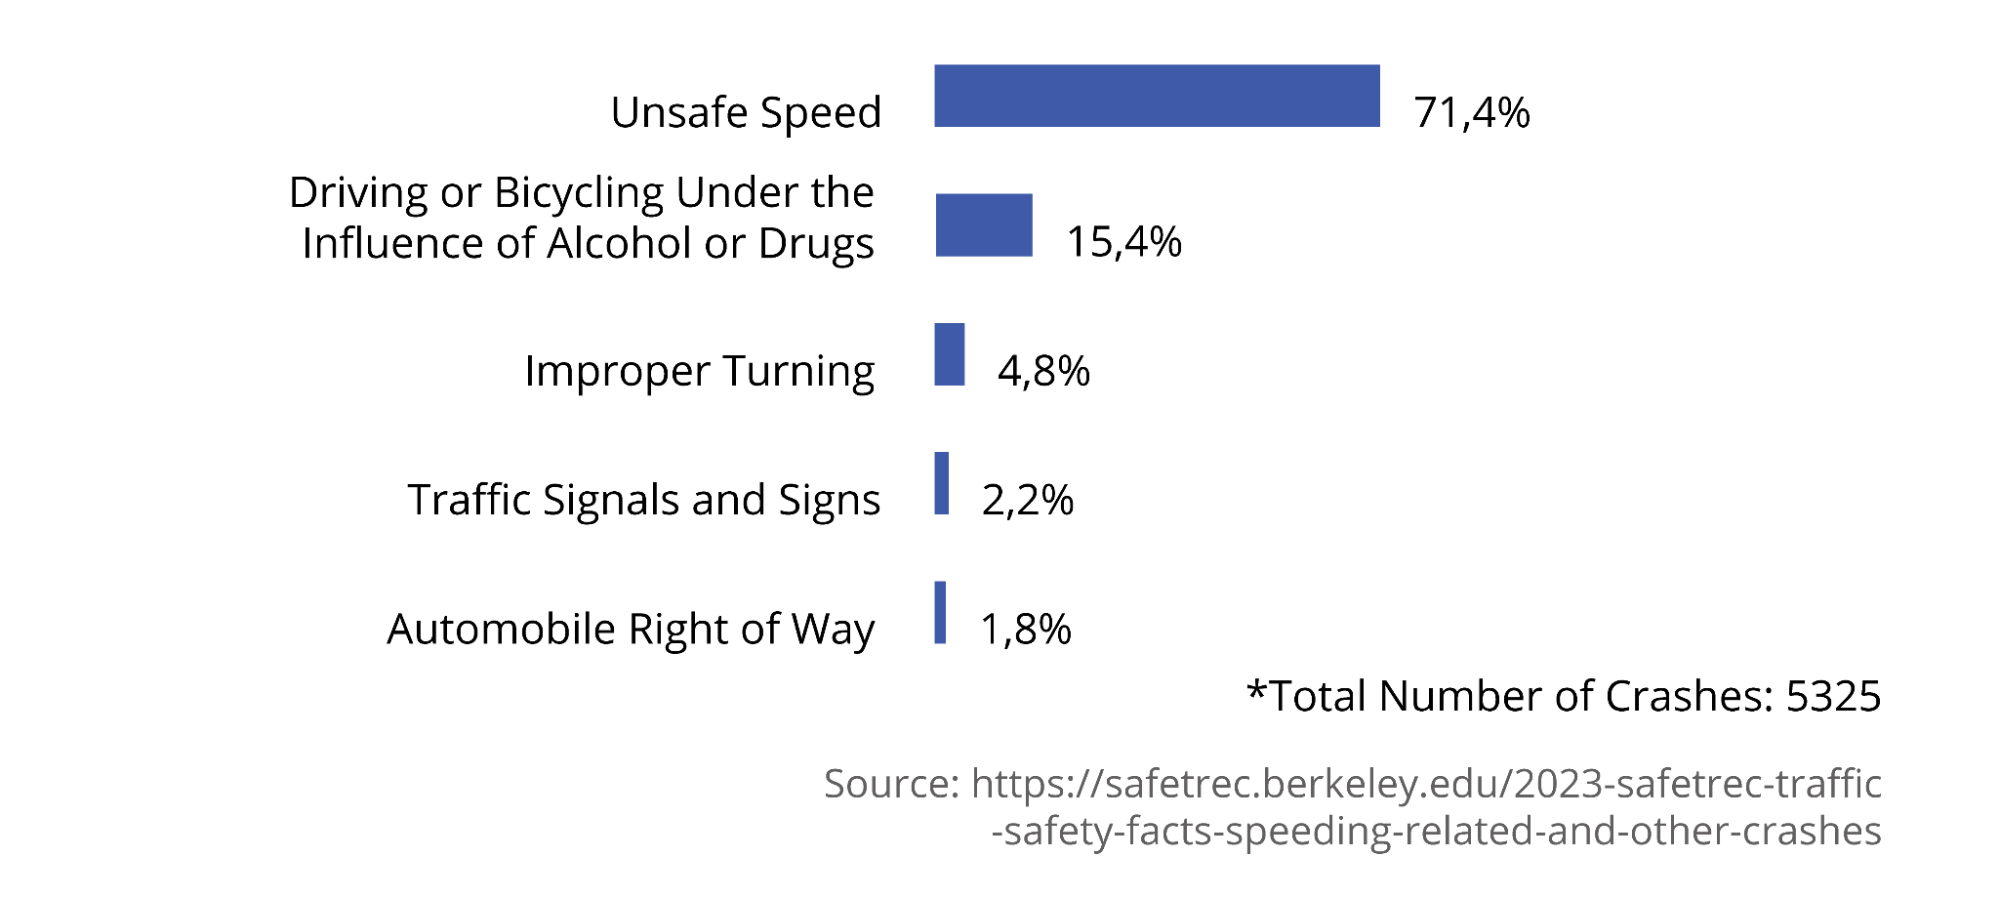
Speeding was the most common reason behind fatal crashes in 2021, according to the Safe Transportation Research and Education Center (SafeTREC) at the University of California, Berkeley.
- 71.4% of fatal and serious injury (FSI) crashes were due to speeding
- Another 15.4% were due to driving or cycling under the influence
- 4.8% of all accidents resulting in serious injuries or death occurred due to improper turning
- Approximately 2.2% happened when the driver missed or ignored road signs and traffic signals
- 1.8% were due to failure to yield right-of-way
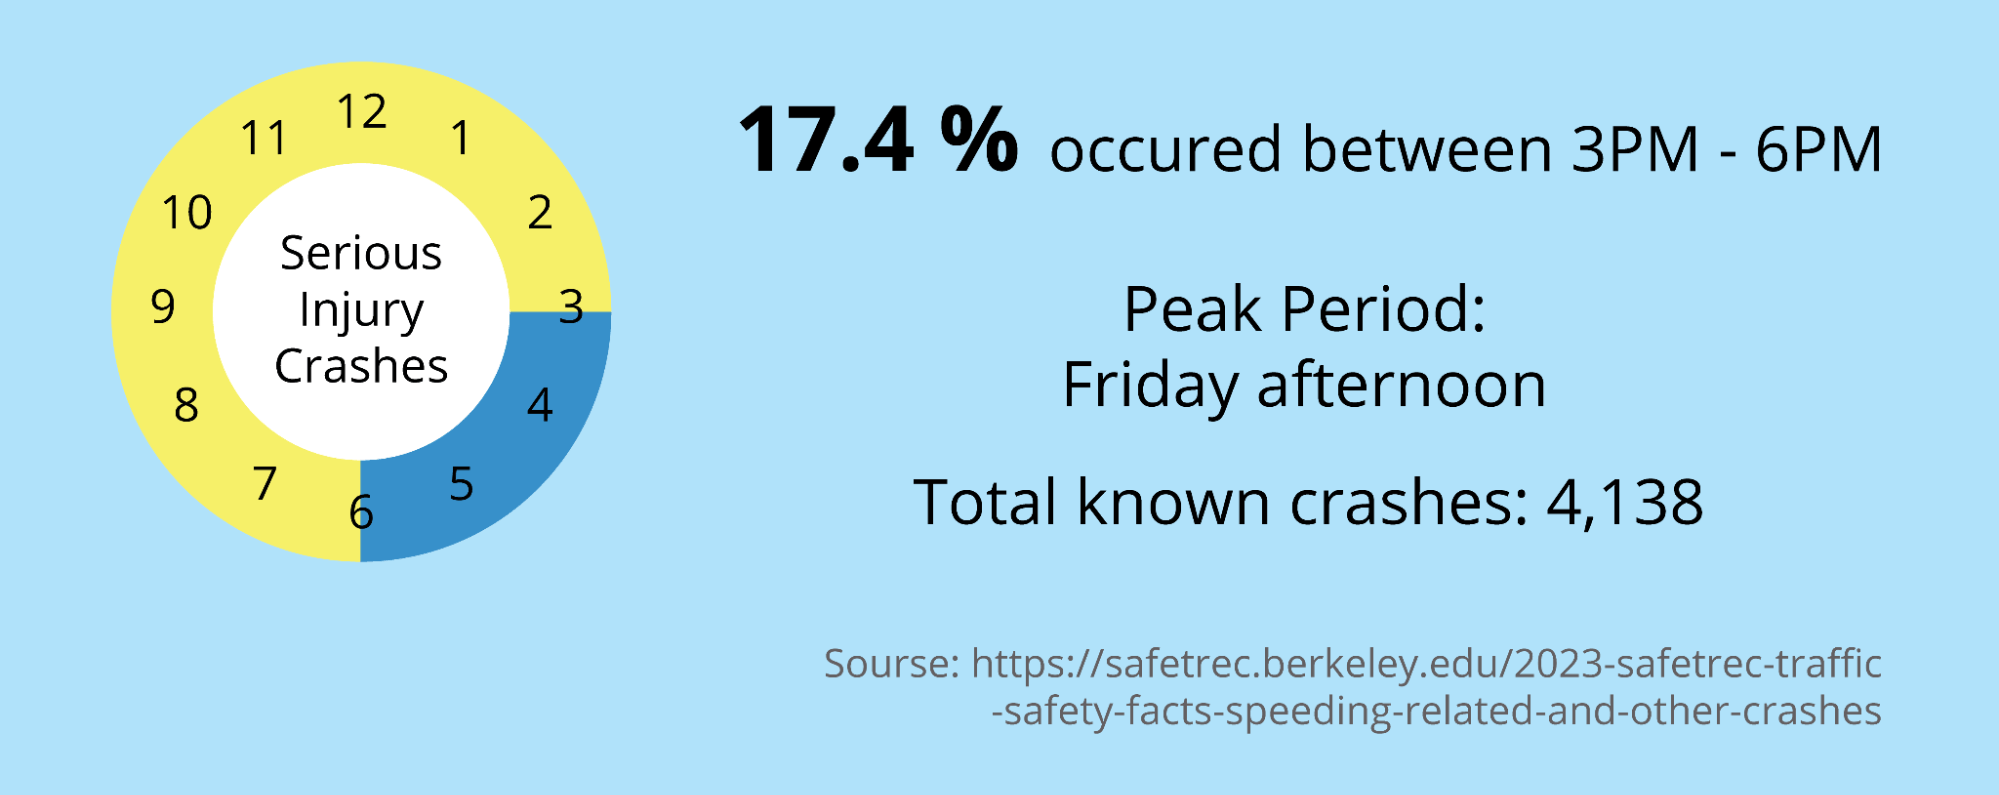
According to the same source, 36% of speeding-related crashes resulting in serious injuries took place on weekends. Over 17% occurred between 3 PM and 6 PM on most days, especially on Fridays.
Read: Is It Illegal to Drive Barefoot?
California Driving Under the Influence (DUI) Statistics
Someone dies in an alcohol-related crash every 39 minutes, notes SafeTREC. Not surprisingly, around 45% of road accidents involving alcohol use occur on weekends, with the peak period being Saturday between 12 AM and 3 AM.
As far as drug use goes, both illegal drugs and certain medications (including OTC medicines) can impair your ability to drive. In 2021, these substances contributed to half of all fatalities (where drivers were tested for drugs) on California roads.
- According to the IIHS, 1,760 of the drivers killed in fatal crashes on California roads in 2021 had a blood alcohol content (BAC) of 0.08% or higher.
- Moreover, the number of alcohol-related fatal crashes in the Golden State went from 1,180 to 1,370 between 2020 and 2021, per the OTS. That’s a 16% increase in just one year.
- Nearly 53% of the drivers who were killed in car crashes in 2021 tested positive for drugs. That’s a 5.5% decrease compared to the previous year.
- In 2022, one-third of fatal car accidents in California involved the use of alcohol, resulting in 1,069 deaths.
- In 2023, police officers reported an average of 340 DUI-related arrests per day, or more than 125,000 over 12 months.
- 4 out of every 100,000 drivers involved in fatal crashes in California test positive for alcohol.
California Motorcycle Crash Statistics
According to the latest OTS data, the number of motorcycle fatalities rose by 3% between 2020 and 2021. 549 people lost their lives in motorcycle accidents in 2020, and another 565 in the following year,
Deaths of motorcycle riders who were not wearing helmets increased by 9% from 2020 (34) to 2021 (37).
| CALIFORNIA MOTORCYCLE CRASH STATISTICS | |||
| 2020 | 2021 | ||
| Motorcycle crash fatalities | 549 | 565 | |
| Riders who were not wearing helmets (deaths) | 34 | 37 | |
The latest SafeTREC report shows the following for 2021:
- 13% of the people who lost their lives in a crash that year in California were motorcyclists. This figure is close to the national average (14%).
- The number of alcohol-impaired motorcyclists involved in fatal crashes increased by nearly 19% between 2020 and 2021.
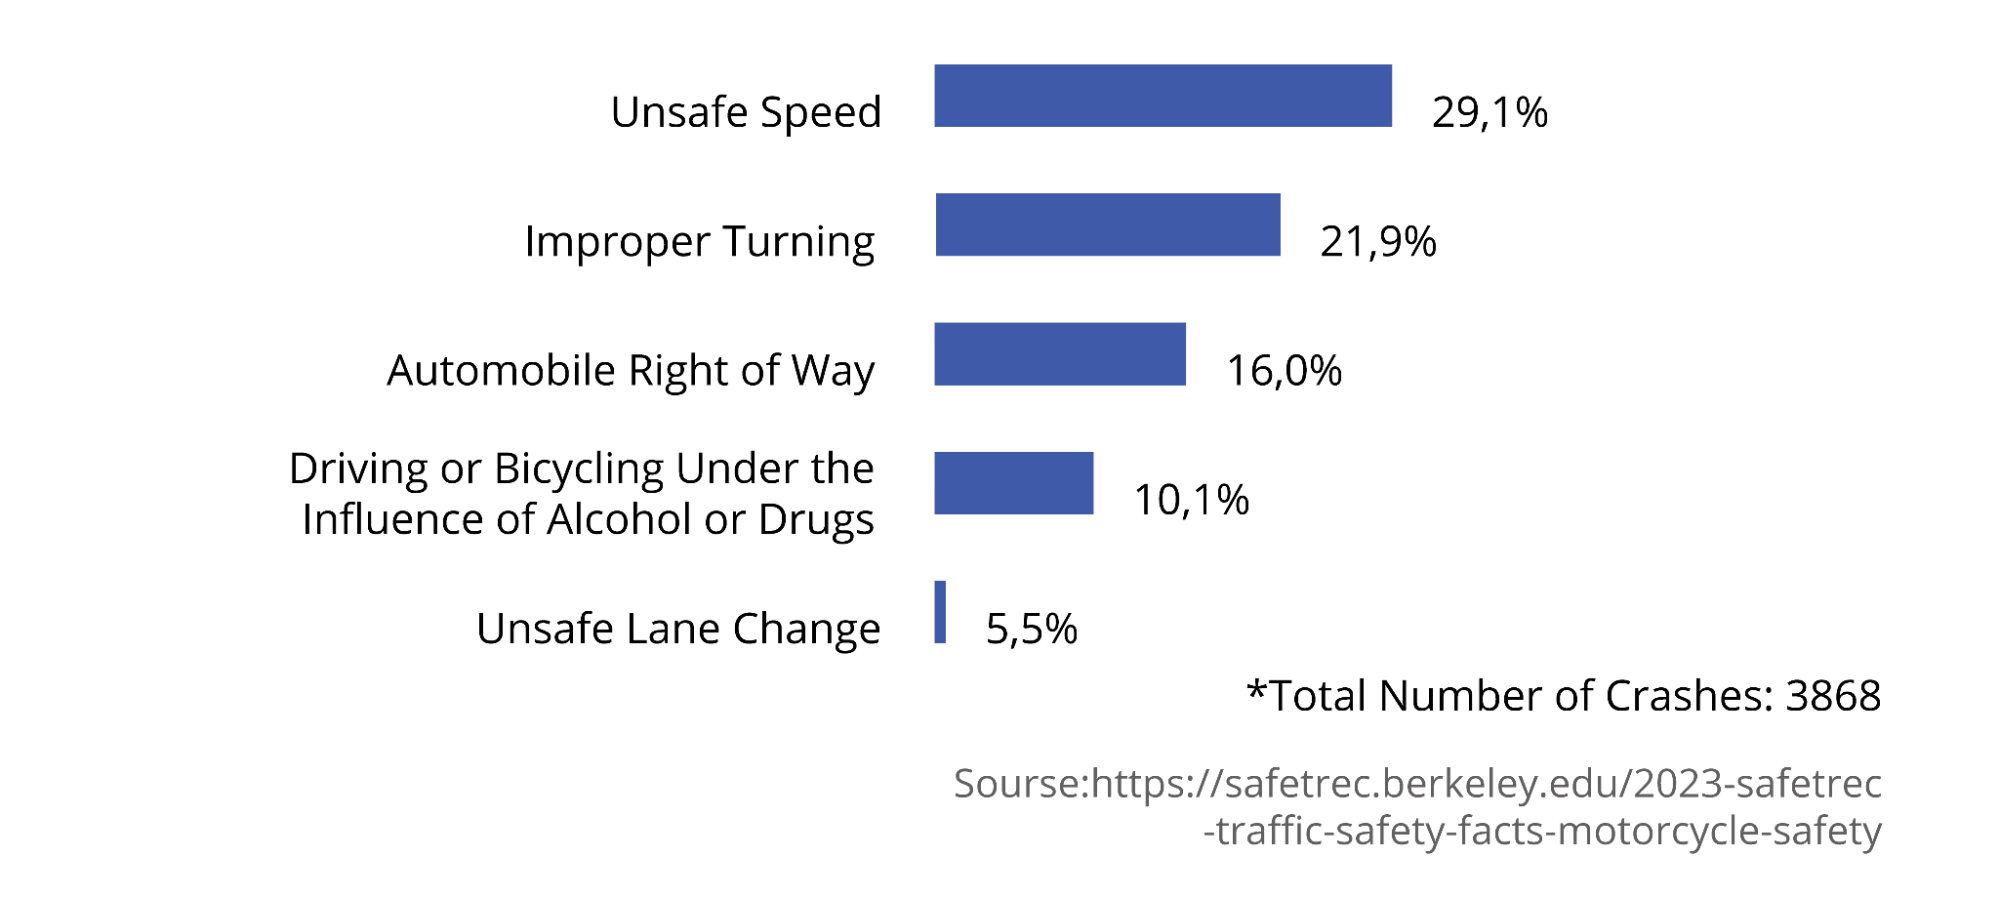
- However, the most common reason behind FSI crashes was speeding. This factor contributed to over 29% of all accidents.
- The second most common reason was improper turning, which played a role in nearly 22% of FSI crashes.
- Failure to yield right-of-way, DUIs, and unsafe lane changes were responsible for 31.6% of all crashes resulting in serious injuries or death.
- SafeTREC also found that, in 2021, 74% of fatal motorcycle crashes occurred in urban areas.
- Another 26% occurred on rural roads—that’s a 7.5% increase compared to 2020.
- Over 40% of fatal crashes and 39.3% of serious injury crashes took place on weekends.
- More than 20% of traffic fatalities occurred between 3 PM and 6 PM on any given day.
- Once again, Los Angeles topped the list of the deadliest cities for road users, registering 120 motorcycle fatalities and 821 crashes resulting in serious injuries.
California Teen Safety Statistics
Per the OTS, the number of teen drivers aged 15 to 20 who died in a crash increased by around 15% between 2020 and 2021, from 413 to 474.
However, these numbers are much higher if we take into account the teenagers who were passengers in a car, pedestrians, motorcyclists, bike riders, or ATV drivers.
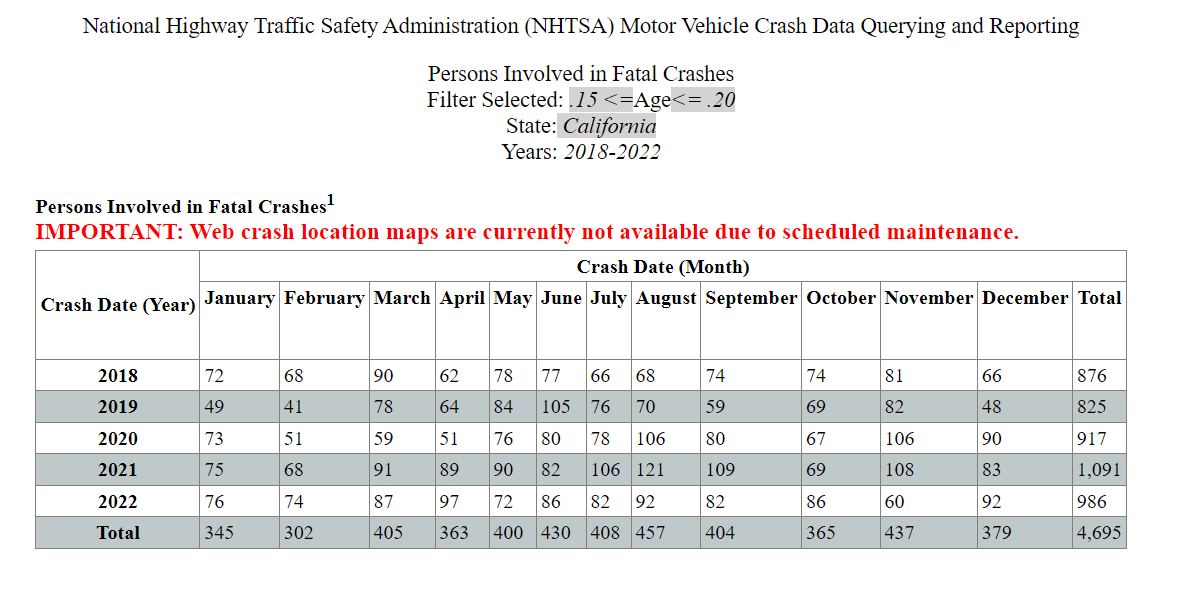
The National Highway Traffic Safety Administration (NHTSA) reports that 986 teenagers aged 15 to 20 were involved in fatal car crashes in 2022. That’s slightly lower compared to 2021 (1,091) but higher than in 2020 (917).
| CALIFORNIA TEEN SAFETY STATISTICS | ||||
| 2020 | 2021 | 2022 | ||
| Deaths of teen drivers in car crashes | 413 | 474 | – | |
| Deaths of teenagers involved in car crashes | 917 | 1,091 | 986 | |
Teen driver safety should be a priority, given that this age group has the highest fatal accident rate. Young drivers aged 16 to 19 are three times more likely to die in a car crash (per mile driven) than those aged 20 or older.
California Pedestrian and Bicycle Safety Statistics
Taking a walk or riding a bike isn’t necessarily safer than driving a car. You could lose your life or sustain serious injuries because of other road users.
- According to the OTS, more than 1,100 pedestrians died in 2021. That’s 9.4% higher compared to the previous year.
- The number of cyclists who died in car crashes went down 8% between 2020 and 2021, from 136 to 125. However, that’s still high at the state level.
| CALIFORNIA PEDESTRIAN AND BICYCLE SAFETY STATISTICS | |||
| 2020 | 2021 | ||
| Pedestrian fatalities in car crashes | 1,013 | 1,108 | |
| Cyclist deaths in car crashes | 136 | 125 | |
Per the latest SafeTREC data, 26% of all traffic fatalities in California involved pedestrians and 2.9% involved bicycle riders in 2021.
- Motor vehicle crashes are responsible for 20 pedestrian deaths per day.
- Over 51% of pedestrian deaths are due to illegal crossings and similar traffic violations.
- Another 16% occur due to CVC 21950, failure to yield to a pedestrian.
- Cyclist deaths, on the other hand, are largely due to speeding. This factor contributes to 17.5% of all fatalities involving bike riders.
- The next most common cause is improper turning, which accounts for 17.1% of cyclist deaths.
- As far as location goes, 91% of fatal pedestrian crashes and 90% of fatal bicycle crashes occur in urban areas.
- More than one-third of traffic fatalities involving pedestrians take place on Fridays and Saturdays.
- Over 36% of traffic fatalities involving cyclists occur on Tuesdays and Fridays.
National Car Crash Statistics
A recent NSC report shows that traffic fatalities decreased by 4% between 2022 and 2023, from 46,279 to 44,450.
Researchers also found that, in 2021, drivers and other road participants aged 25 to 44 had the highest fatal crash rate of all age groups. More than 16,00 people in this age group lost their lives.
| STATISTICS FROM THE NATIONAL SAFETY COUNCIL (2021) | |
| Type of crash | Number of deaths among all age groups |
| Collision between motor vehicles | 20,200 |
| Collision with a fixed object | 12,600 |
| Collision with a bicycle | 1,400 |
| Collision with a pedestrian | 9,100 |
| Collision with a railroad train | 111 |
| Non-collisions | 3,500 |
| Total | 46,980 |
Now let’s see how California compares to the national average.
- Speeding-related crashes: In 2021, 29% of traffic fatalities nationwide were due to speeding, according to SafeTREC. In California, this factor contributed to 35% of motor vehicle deaths.
- DUI: In the same year, 31% of traffic fatalities in the U.S. involved car drivers with a BAC of 0.08 or higher. In California, alcohol consumption was responsible for 32% of all deaths on the road.
- Drug-related fatalities: Drug use contributed to 52% of traffic fatalities in the U.S. and 50% of those in California.
- Distracted driving: This factor played a role in 8% of all motor vehicle deaths nationwide and 3% of those on California roads.
- Motorcycle fatalities: In 2021, 14% of fatal motor vehicle crashes across the U.S. and 13% of those in California involved motorcyclists.
- Bicycle fatalities: Only 2.2% of fatal road accidents nationwide involved cyclists. In California, cyclist deaths accounted for 2.9% of traffic fatalities.
- Pedestrian fatalities: Three years ago, 17% of traffic fatalities nationwide and 26% of those in the Golden State resulted in pedestrian deaths.
Overall, California has a higher rate of fatalities on the road compared to the national average. Distracted driving appears to be less common than in other states, but it still contributed to 140 deaths in 2021 alone.
It’s also worth mentioning that California was the second deadliest state for drivers in the first half of 2023, with 2,061 fatalities. The highest death rate was registered in Texas, where 2,089 people lost their lives in road accidents, per the NHTSA.
By comparison, the District of Columbia reported only 25 deaths in the first six months of 2023. Delaware, Maine, North Dakota, Rhode Island, Vermont, and several other states had fewer than 50 fatal motor vehicle crashes.
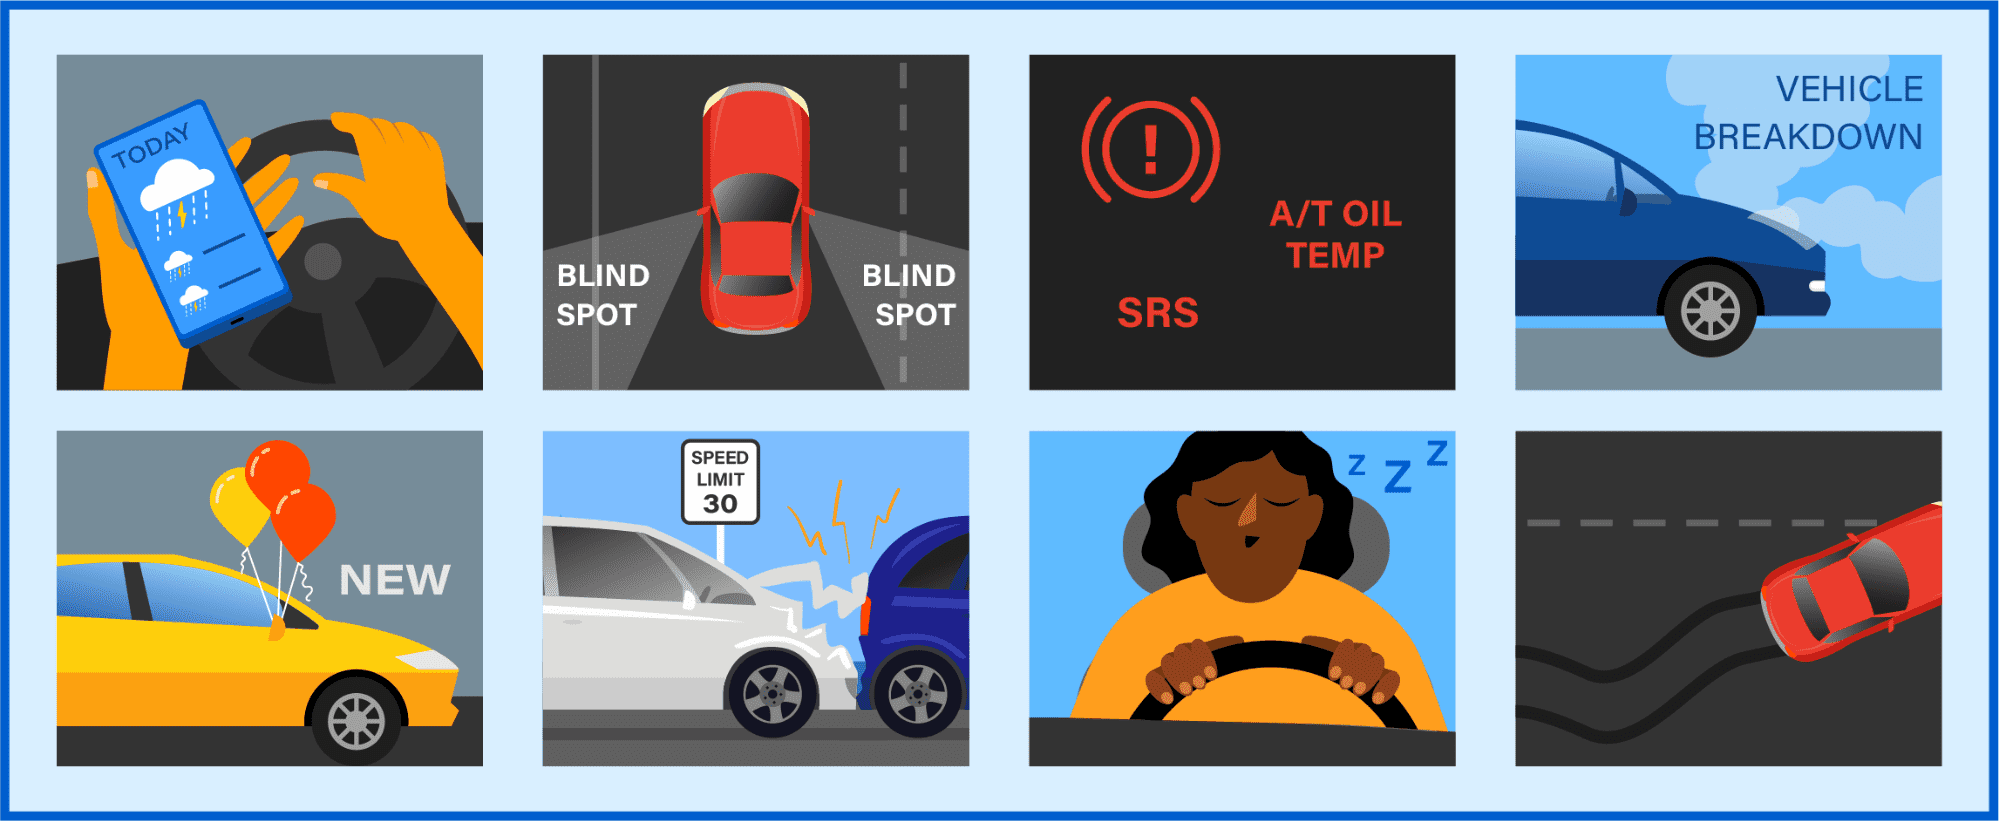
What Causes Car Crashes?
Most car crashes can be categorized into three categories – roadway environment, the vehicle, and human factors.
Roadway environment factors include external conditions such as weather and environmental hazards, road conditions and road design.
Vehicle factors are mechanical failures, such as equipment failures or vehicle breakdowns.
Human factors include behaviors (like driving at an unsafe speed), as well as distractions, anger, and other emotions.
Some of the most common causes for car crashes are below.
Roadway Environment Factors
- Unsafe road conditions. Unsafe road conditions can occur for many reasons. They may be caused by people or animals on the road; bad weather like snow, ice, or fog; or even simply darkness. Drivers typically have no control over these conditions, but it’s still up to them to do their best to drive safely.
- Blind spots. Sometimes, an obstruction outside of the vehicle causes a blind spot that prevents you from seeing clearly while driving. This could be snow, mud, dirty water, litter, or even debris like fallen leaves or tree branches that can fall onto your vehicle while you’re driving. If this happens, pull over as soon as you can safely do so to remove the obstruction.
Vehicle Factors
- Failure of safety equipment. Safety equipment such as lights, brakes, and airbags need to be properly maintained to stay in good working order. If any of these parts fails while you’re driving, it could contribute to a crash.
- Vehicle breakdown. Vehicles can break down while you’re driving. If this happens in a high-traffic area, it can be particularly dangerous and create higher risk of a crash.
- Blind spots. Almost all vehicles have blind spots. It’s up to you to check your blind spot periodically, especially before you make any maneuvers that involve moving into your blind spot (like changing lanes).
Human factors
- Lack of driving experience. Driving experience is gained through practice over time, as drivers learn from the different experiences they have behind the wheel. A lack of experience is one factor that can contribute to crashes — especially when it comes to the higher number of crashes involving young people.
- Failure to recognize danger. Sometimes there’s a hazard or risk, and a driver simply doesn’t recognize it. This can easily lead to crashes.
- Rear-end collisions. Rear-end collisions are some of the most common crashes, which are frequently caused by drivers becoming distracted at stop signs or signals, or in areas with enough traffic congestion to cause slow-downs.
- Falling asleep. Drowsy driving is extremely dangerous, and more common than you think. Hundreds of crashes each year occur because a driver nods off at the wheel.
- Loss of control. Loss of control can happen for a variety of reasons, from bad weather to distractions to driving too fast. Lane departures are a common cause for traffic accidents, and they can easily occur when a driver loses control of their vehicle.
How to Avoid Car Crashes
It’s not always possible to avoid car crashes; in fact, the average person is involved in 3-4 car accidents over the course of their life. However, you can take steps to keep yourself and others safe on the road.
Plan Ahead
Get into the habit of checking the weather and road conditions before you drive, so you know of any hazards you need to look out for. Plan ahead to leave early enough that you have plenty of time to get to your destination without speeding. And plan to drive at the best times of the day — like when there’s good light and visibility, but not too much traffic.
These are just a few of the ways that planning ahead can make you a safer driver and help you avoid crashes.
Scan Your Surroundings
Drivers should be constantly scanning their surroundings for potential hazards — and that doesn’t mean just the road ahead. As you drive, you should move your eyes constantly from the road in front of you, to the sides of your car, to the rearview mirror, and back. This will allow you to see a hazard no matter what direction it comes from.
Regulate Your Emotions
Being emotional does not make you a better driver. In fact, being angry or sad behind the wheel can distract you, make you less aware of risk, and decrease your inhibitions. If you’re feeling any strong emotions, try to delay driving until you feel better.
The same goes for when you’re already behind the wheel. Try not to let other drivers’ actions affect your emotions, as this can lead to road rage and accidents.
Avoid Distractions While Driving
Distracted driving is a major hazard, both for you and for other drivers on the road. Distractions can include anything that distracts your eyes from the road and areas around you, your hands from the wheel, or your mind from the task at hand: driving. Avoid distractions while you’re behind the wheel by putting your phone on do-not-disturb, choosing music and setting up the GPS before you leave, and focusing on driving safely.
Learn Defensive Driving Techniques
All of the tips above are techniques commonly used in defensive driving. You can learn about these and other defensive driving techniques by taking a course.
In California, the Mature Driver Improvement Program is available online in a fast, convenient, and affordable format. This course is meant to help mature drivers refresh their knowledge of the California Vehicle Code and common driving skills. Drivers over 65 years of age receive an automatic discount on their auto insurance rates for completing the course — younger drivers may be eligible for discounts at the discretion of their insurance carrier.