Although traffic fatalities in California are on the decline in 2024, thousands of people still lose their lives on California’s roads each year. Distracted driving, alcohol use, speeding, and other risky behaviors can turn ordinary cars into deadly weapons.
Here we’ll cover the latest car crash statistics in California — and why they matter.
California Car Crash Statistics: An Overview
According to the latest data from the National Highway Traffic Safety Administration (NHTSA), California recorded 3,807 traffic fatalities in 2024. That’s a 6.3% drop from 2023, and the lowest figure since 2019.
The total number of car accidents in California reached 164,123 in 2024, per UC Berkeley’s Statewide Integrated Traffic Records System (SWITRS). This figure includes collisions of varying severity, from minor injuries to fatal outcomes.
The same source reports the following:
- In 2024, 12,085 pedestrians were either injured or killed in motor vehicle crashes across California. Los Angeles alone reported 1,438 pedestrian fatalities and injuries.
- 9,852 bicyclists lost their lives or suffered injuries in crashes on California’s roads in 2024. About 1,327 were children or teens.
- In 2024, 16% (26,361) of all car accidents in California involved alcohol. Another 1.4% (2,271) were drug-related. (Discover more drunk driving statistics.)
- Nearly half of all motor vehicle crashes (77,822) in the state were due to speeding.
- Distracted driving, such as texting and driving, contributed to 6.2% (10,198) of all collisions in California.
- In California, the number of vehicle crashes and traffic fatalities involving cyclists or older adults was higher in 2024 compared to the previous four years. (Read more bike accident statistics.)
- L.A. recorded more traffic crashes than any other city in California between 2020 and 2024. Heavy traffic, a sprawling road network, poor pedestrian infrastructure, and other factors make it a hotspot for accidents.
| CALIFORNIA CAR CRASH STATISTICS, 2024 | |
|---|---|
| 164,123 | Total motor vehicle crashes |
| 77,822 | Speeding-related crashes |
| 26,361 | Alcohol-related crashes |
| 10,198 | Distracted driving crashes |
| 2,271 | Drug-related crashes |
| 3,807 | Traffic fatalities |
| 12,156 | Motorcyclist fatalities and injuries |
| 12,085 | Pedestrian casualties |
| 9,852 | Cyclist casualties |
| Source: California SWITRS | |
How California Compares to Other U.S. States
Depending on the source, somewhere between 39,345 and 44,680 people lost their lives in car crashes in the U.S. in 2024. These numbers confirm that traffic crashes remain one of the leading causes of preventable death in the U.S.
“Without significant changes, potential danger will continue to pose ongoing risks to the millions of Americans who rely on our roads daily. We must make new commitments to support safer conditions for all road users to ensure everyone makes it home safely,” says Mark Chung, NSC’s executive vice president of safety leadership and advocacy.
According to NHTSA data, California remains one of the deadliest states for drivers, despite a drop in traffic fatalities in 2024.
Let’s take a look at which states have the most car accidents and fatalities:
| State | Estimated Traffic Fatalities in 2024 | Car Crash Rate* |
|---|---|---|
| Alabama | 976 | 4.28% |
| Alaska | 60 | 4.48% |
| Arizona | 1250 | 3.86% |
| Arkansas | 606 | 3.71% |
| California | 3807 | 4.34% |
| Colorado | 687 | 4.39% |
| Connecticut | 330 | 4.22% |
| Delaware | 127 | 4.27% |
| Florida | 3188 | 3.41% |
| Georgia | 1423 | 4.63% |
| Hawaii | 102 | 3.31% |
| Idaho | 240 | 4.81% |
| Illinois | 1208 | 3.02% |
| Indiana | 827 | 4.54% |
| Iowa | 358 | 4.55% |
| Kansas | 342 | 4.39% |
| Kentucky | 714 | 3.54% |
| Louisiana | 746 | 3.88% |
| Maine | 179 | 5.38% |
| Maryland | 579 | 4.77% |
| Massachusetts | 368 | 6.07% |
| Michigan | 1047 | 1.68% |
| Minnesota | 478 | 3.35% |
| Mississippi | 723 | 2.86% |
| Missouri | 965 | 4.34% |
| Montana | 205 | 3.79% |
| Nebraska | 250 | 5.13% |
| Nevada | 420 | 4.00% |
| New Hampshire | 135 | 5.81% |
| New Jersey | 695 | 3.44% |
| New Mexico | 400 | 3.03% |
| New York | 1105 | 4.46% |
| North Carolina | 1659 | 4.91% |
| North Dakota | 90 | 4.08% |
| Ohio | 1160 | 4.62% |
| Oklahoma | 642 | 3.58% |
| Oregon | 539 | 4.73% |
| Pennsylvania | 1139 | 4.52% |
| Rhode Island | 52 | 5.63% |
| South Carolina | 1041 | 4.83% |
| South Dakota | 146 | 4.37% |
| Tennessee | 1202 | 4.18% |
| Texas | 4162 | 3.82% |
| Utah | 280 | 4.98% |
| Vermont | 59 | 4.72% |
| Virginia | 910 | 4.83% |
| Washington | 730 | 3.53% |
| West Virginia | 255 | 3.93% |
| Wisconsin | 575 | 3.83% |
| Wyoming | 107 | 3.78% |
|
Sources:
NHTSA,
Insurify *Based on the number of accidents per the total number of drivers. |
||
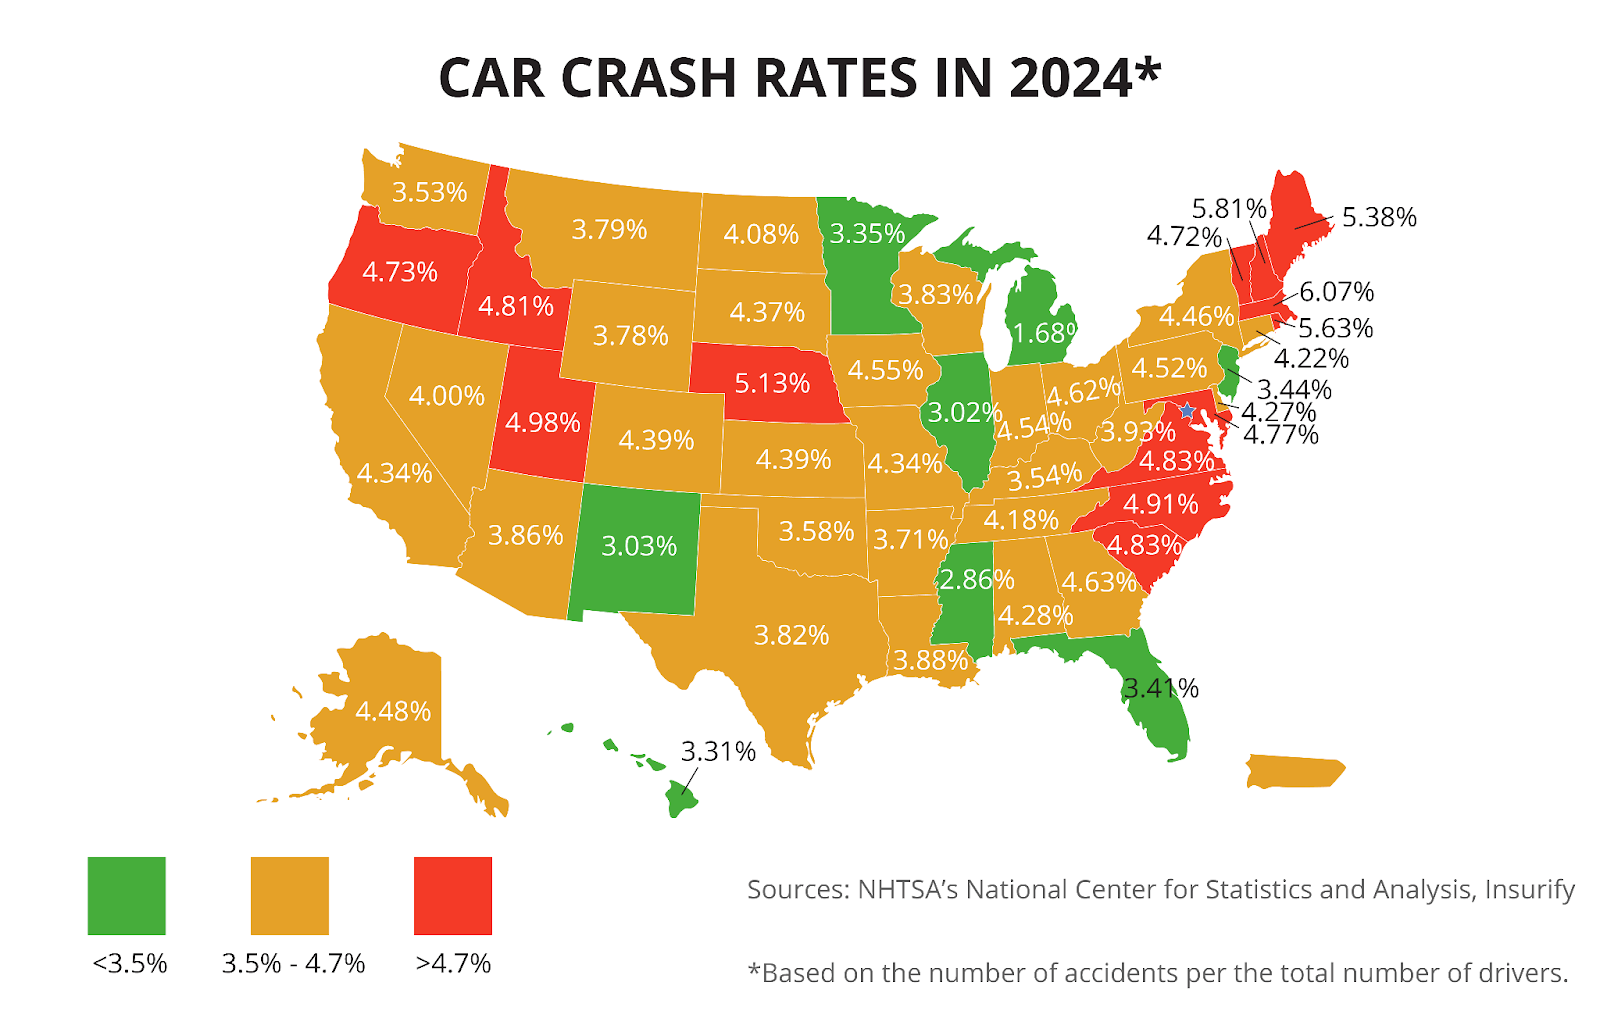
More populous or geographically larger states tend to see higher numbers of traffic fatalities due to increased vehicle miles traveled. In 2023 and 2024, California had the second-highest traffic fatality rate after Texas due to dense urban traffic, long commutes, and risky behaviors, such as impaired or distracted driving. However, overall crash rates were higher in Massachusetts, New Hampshire, Rhode Island, and other states compared to California.
Read: Why Are California Drivers So Bad?
California Car Crashes by City
Wondering which California cities see the most car crashes? Per SWITRS data, Los Angeles recorded more traffic crashes in 2024 than any other city in the state. L.A. also had the highest traffic fatality rate in the state, with 256 people killed on its roads. Let’s see what the numbers say:
| CALIFORNIA CAR CRASHES BY CITY (2024) | ||
|---|---|---|
| Rank | City | Total Crashes |
| 1 | Los Angeles | 11,120 |
| 2 | San Diego | 5,734 |
| 3 | Sacramento | 3,589 |
| 4 | San Francisco | 3,329 |
| 5 | San Jose | 3,308 |
| 6 | Long Beach | 2,338 |
| 7 | Anaheim | 2,285 |
| 8 | Oakland | 1,986 |
| 9 | Riverside | 1,979 |
| 10 | Santa Ana | 1,791 |
California Car Crashes by Age
In 2023, drivers aged 25 to 34 made up 21.9% of all drivers involved in car crashes — the highest of any group. They were followed by those aged 35 to 44, and then motorists between 45 and 54 years old, according to the NSC.
This trend can be observed in California, too. According to the Safe Transportation Research and Education Center (SafeTREC), young adults aged 25 to 34 accounted for 26.2% of all Californians involved in collisions in 2022 (the most recent year for which data is available). Let’s take a look at the data:
| Age | % of Californians involved in car crashes |
|---|---|
| 15–24 | 21.3% |
| 25–34 | 26.2% |
| 34+ | 52.2% |
Surprisingly, teen drivers have lower traffic crash rates than other age groups. One explanation is that they drive fewer miles overall — often under parental supervision.
Additionally, many Californians under 18 hold a probationary driver’s license, which comes with certain restrictions aimed at keeping them safe on the road. For example, they may not drive between 11 p.m. and 5 a.m. unless they must go to work or school and have no other means of transportation. This alone can significantly reduce the odds of an accident, given that about half of all traffic fatalities occur at night.
California Car Crash Causes
Car crashes happen for all sorts of reasons, from reckless driving to unsafe lane changes and excessive speeding. With that in mind, let’s take a quick look at data from SWITRS and other official sources:
- In 2024, alcohol use contributed to 26,361 car crashes on California’s roads.
- Drug-impaired driving resulted in 2,271 traffic fatalities and injuries in California in 2024.
- Distracted driving contributed to nearly 10,200 accidents in California in 2024.
- Speeding was linked to 77,822 collisions in California in 2024.
- The top five causes of fatal and serious injury crashes involving older adults in 2022 were improper turning (18.2%), unsafe speed (15.8%), and pedestrian violations (10.8%). Failure to yield the right-of-way contributed to another 19.8% of collisions, according to SafeTREC.
- Most traffic fatalities in California occur between 4 p.m. and 8 p.m. In 2023, 22.4% of all fatal crashes in the state occurred during this interval, according to NSC data. Another 22% took place between 8 p.m. and midnight.
- The risk of a fatal accident was highest over the weekend, with 17.5% of incidents happening on a Saturday.
- California drivers are most likely to be involved in a deadly crash between 8 p.m. and midnight on Saturdays or between midnight and 4 a.m. on Sundays, according to the NSC.
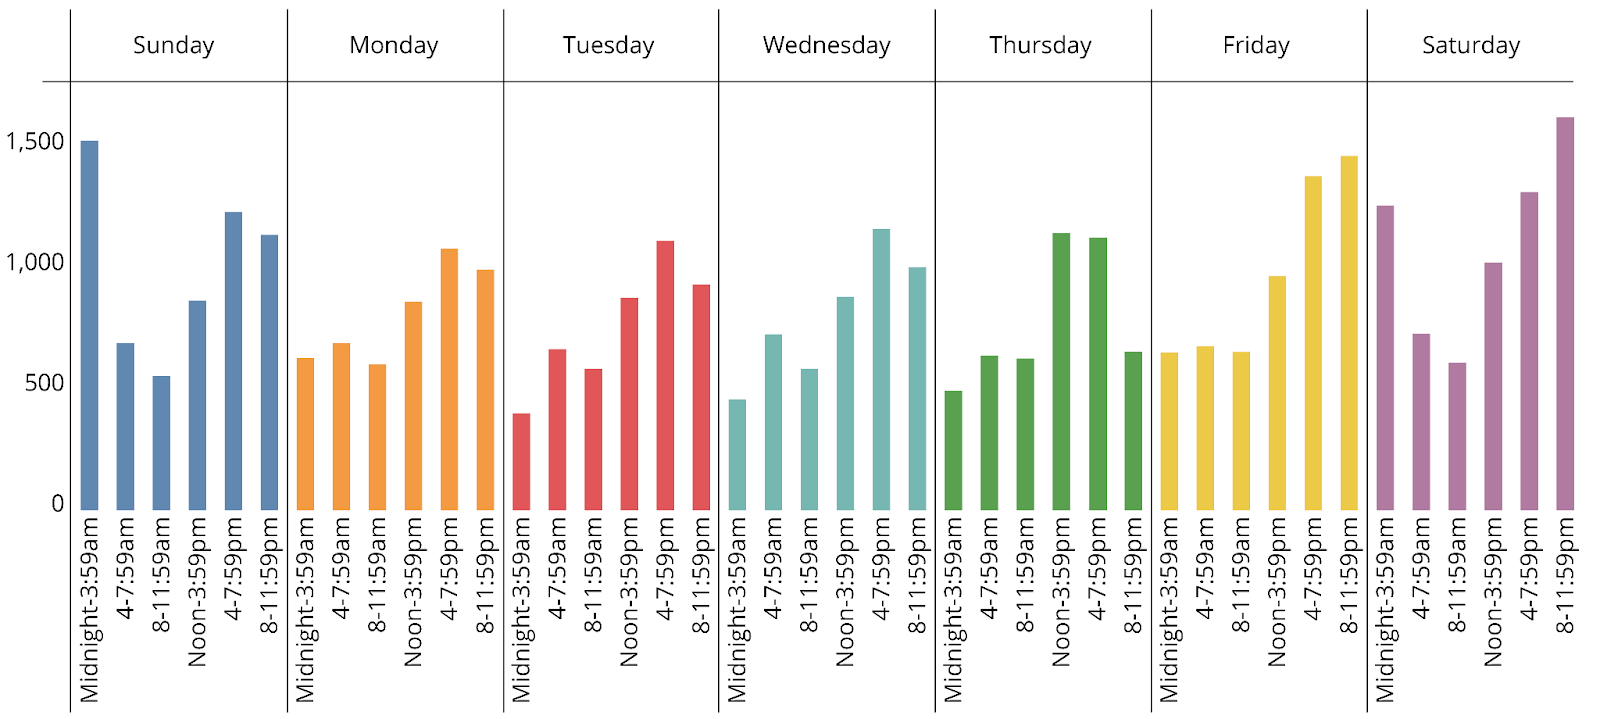
Source: NSC
California Car Crashes Involving Pedestrians and Cyclists
According to SWITRS data:
- 3,662 pedestrians, including 158 children, sustained serious injuries or lost their lives in car crashes between 2022 and 2024 in California. This is down from a peak of 3,790 in 2023.
- In 2024, pedestrian accidents across California declined slightly but still resulted in 950 deaths.
- Approximately 9,271 California cyclists were involved in traffic accidents between 2022 and 2024, with 148 suffering fatal injuries in 2024.
Car Crash Causes
Car crashes are generally attributed to three main factors: roadway conditions, the vehicle itself, or the driver’s actions. Let’s see how these aspects contribute to accidents in California and beyond:
- In 2022, nearly one-third of traffic fatalities (12,151) involved speeding. This factor has been responsible for more than 25% of deadly crashes over the past decade, reports the IIHS.
- 3,126 drivers who died in car crashes in 2022 were distracted at the time of the event. Around 63% were “lost in thought,” 12% were using their cell phones, and 9% were distracted by an outside person, object, or event, according to IIHS.
- Alcohol-impaired driving was responsible for 12,429 deaths in 2023. On average, 34 people in the U.S. lose their lives in drunk-driving crashes each day.
- Drowsy driving contributed to 633 traffic fatalities in 2023.
- Reckless driving contributed to 2,251 road fatalities and thousands of accidents resulting in bodily injury or property damage in 2022, per the Insurance Information Institute (III).
- Rain, snow, fog, and other factors that affect visibility while driving were responsible for 2.6% of all traffic fatalities in 2022, reports the III.
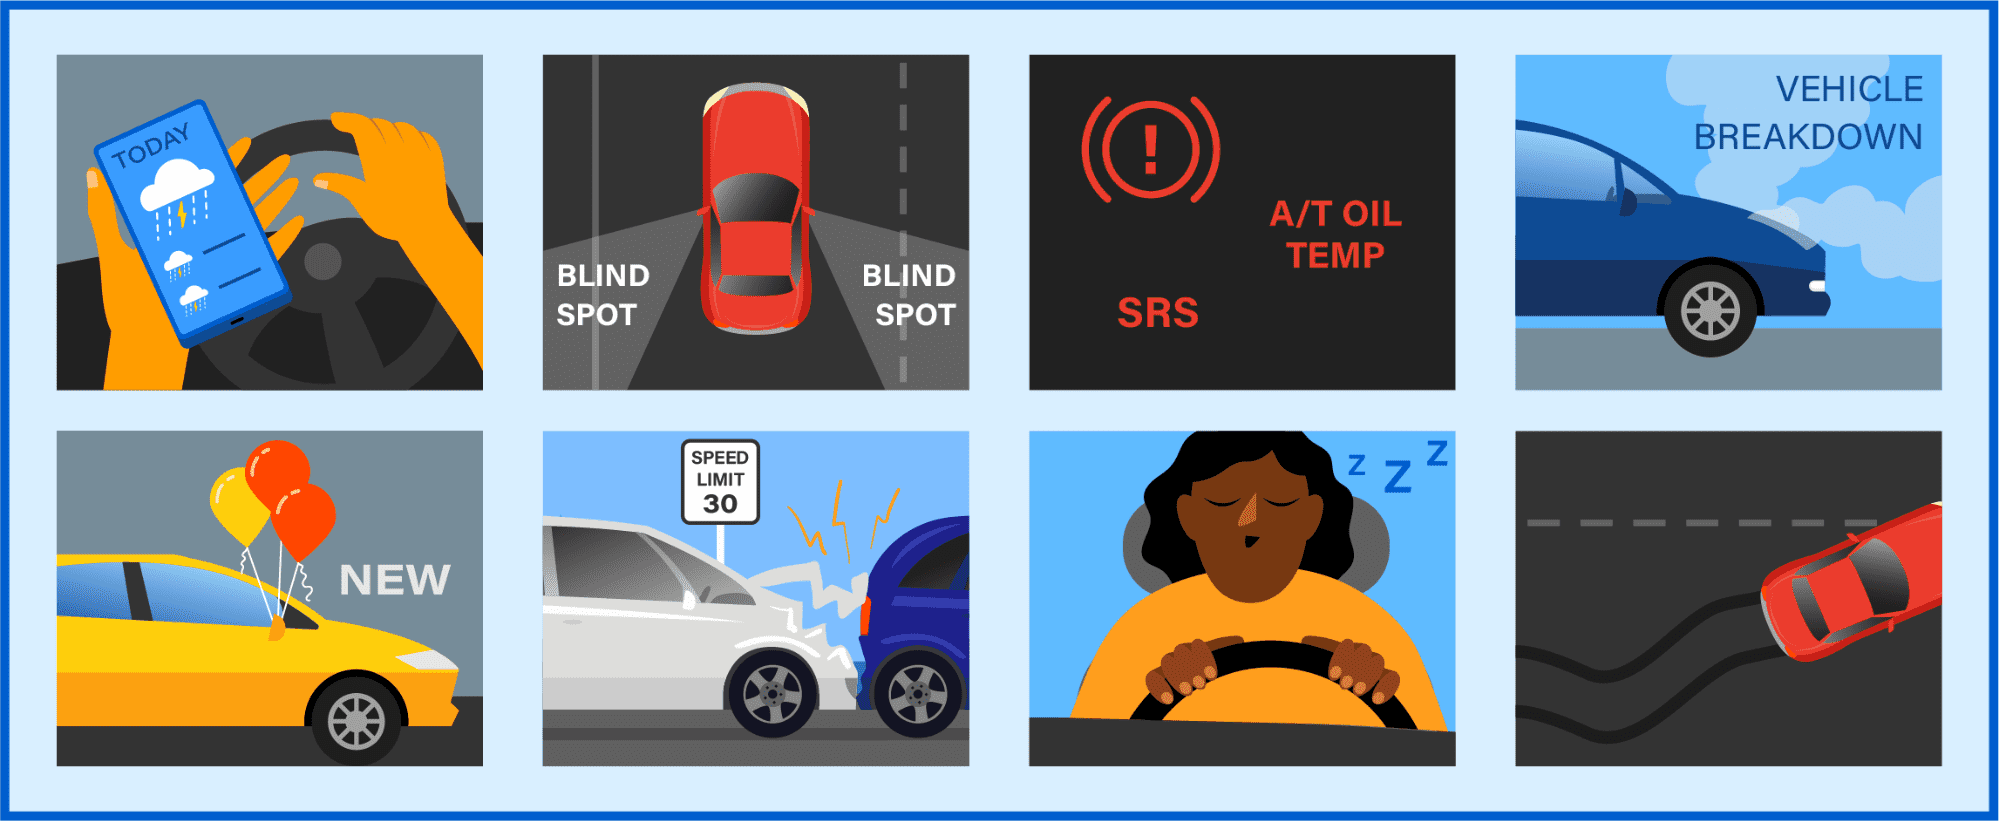
Car accidents may also result from blind spots, hazardous road conditions, mechanical failures, or dangerous behaviors, such as tailgating, oversteering, and failure to obey traffic signals. These unfortunate events are largely preventable — yet, many drivers ignore simple precautions, putting lives at risk.
How to Avoid Car Crashes
The average U.S. driver will be involved in three to four collisions during their lifetime. While it’s not always possible to avoid these events, you can take steps to reduce their likelihood and stay safe on the road.
Below are some preventive measures every driver should be aware of:
- Plan ahead: Check the weather and road conditions before you head out so you’re aware of any hazards. Consider leaving earlier to ensure you have enough time to reach your destination without speeding. (In addition to speeding being dangerous, you could also get a speeding ticket!) If possible, drive during daylight hours when there’s good visibility and lighter traffic.
- Scan your surroundings: As you drive, shift your gaze from the road ahead to the sides of your vehicle, the rearview mirror, and back again. This habit helps you spot potential hazards, regardless of the direction they’re coming from.
- Regulate your emotions: Stress and strong emotions like anger or sadness can affect your judgment, attention, alertness, and reaction time. When you’re emotionally overwhelmed, delay driving until you feel better. If you’re already behind the wheel, focus on the road and don’t let other drivers push your buttons.
- Avoid distractions: Distractions come in many forms: texting, eating, fiddling with music, or setting up your GPS. Avoid these activities while driving to keep yourself and others safe on the road. (Plus, according to California cell phone laws, even touching your phone while driving is illegal.)
- Be a defensive driver: All of the above are defensive driving techniques and could save your life. You can learn about these and other strategies by taking an online course. It’s an opportunity to become a safer driver and lower your insurance premiums by up to 15% per year.
Can You Go to Traffic School for a Crash?
California drivers can attend traffic school to “mask” one-point moving violations from their records. An example would be crossing a solid white line or failing to yield the right-of-way. Upon course completion, the point you received will be hidden from insurance carriers and prevent your rates from increasing.
This option is only available for traffic infractions, not accidents. However, some courts may order traffic school as part of a plea bargain – that is, if you meet traffic school eligibility requirements.
At Best Online Traffic School, we offer an online course you can complete in less than three hours. We are a DMV-approved traffic school that’s accepted by all courts, making it easy to keep points off your record.
Once enrolled, you can study at your own pace from any device. Complete our course in one sitting or over several weeks while enjoying perks like:
✅ Interactive learning experience
✅ Easy-to-follow study materials
✅ Practice tests after each lesson
✅ Save-and-resume feature
✅ Unlimited course retakes
✅ Free audio read-along in English, Spanish, and Chinese
✅ 24/7 live chat support
✅ Open-book final exam
Once the course is over, we’ll issue an electronic certificate for your records. To save you time, our team will also submit a copy to both the court and the DMV.
The best part? You can take our traffic school course for free and pay only after you pass. Our flat fee of only $27.99 covers the study materials and everything else, including your certificate of completion.
Don’t let a traffic ticket turn your life upside down. Start traffic school for free to refresh your knowledge and keep a clean driving record.
Read: Is Traffic School Worth It?
FAQs about Car Crashes in California
Looking for more information about car crashes in California? Below are the answers to some frequently asked questions.
What are most car accidents caused by?
According to NHTSA data, 94% of crashes are due to human error, such as driving too fast or too slow for the conditions. Even minor mistakes like changing the radio while driving or taking your eyes off the road for a few seconds can lead to traffic fatalities or injuries.
What are the odds of getting in a car crash?
For most Americans, the lifetime probability of having a car accident is one in 95. By comparison, your chance of being in a plane crash is around one in 260,256.
These findings confirm that driving is far less safe than we assume.
How many car accidents are normal?
While no car accident is ever “normal,” most U.S. drivers will go through at least three or four during their lifetime.
What age groups cause the most car accidents?
Drivers aged 25 to 34 face the highest risk of being involved in a car accident. In 2023, nearly 22% of all car crashes involved drivers from this age group.